
Blog | 7-minute Read
8 data and analytics use cases which drive business value

Mitesh Desai
Director of Technology & Innovation
Published: 16 April 2021
The ways that data and analytics can be used to drive business value are as varied as the organisations themselves.
When a company sets out with a clear goal in mind and takes ambitious steps to accelerate their data and analytics maturity, the results can be significant, for both internal and external stakeholders alike.
In this article, we’re going to look at eight examples of real-world data and analytics initiatives that we’ve seen drive business value for our clients.
1. Reducing inefficiencies
SMBs are increasingly using data and analytics to automatically identify and address inefficiencies. For example, a global manufacturer of agricultural equipment was having issues with their training division with spaces rented for dealership training courses frequently going unused.
Invariably these inefficiencies only became evident at the end of the year – long past the time when something could have been done to address the issue.
Working with the client we were able to automate data collection across multiple systems to provide insight. Having a cohesive, real-time overview of bookings for individual courses allowed them to proactively target under-utilised training courses and to approach specific dealers who were underperforming in the areas being offered for training.

Free Guide
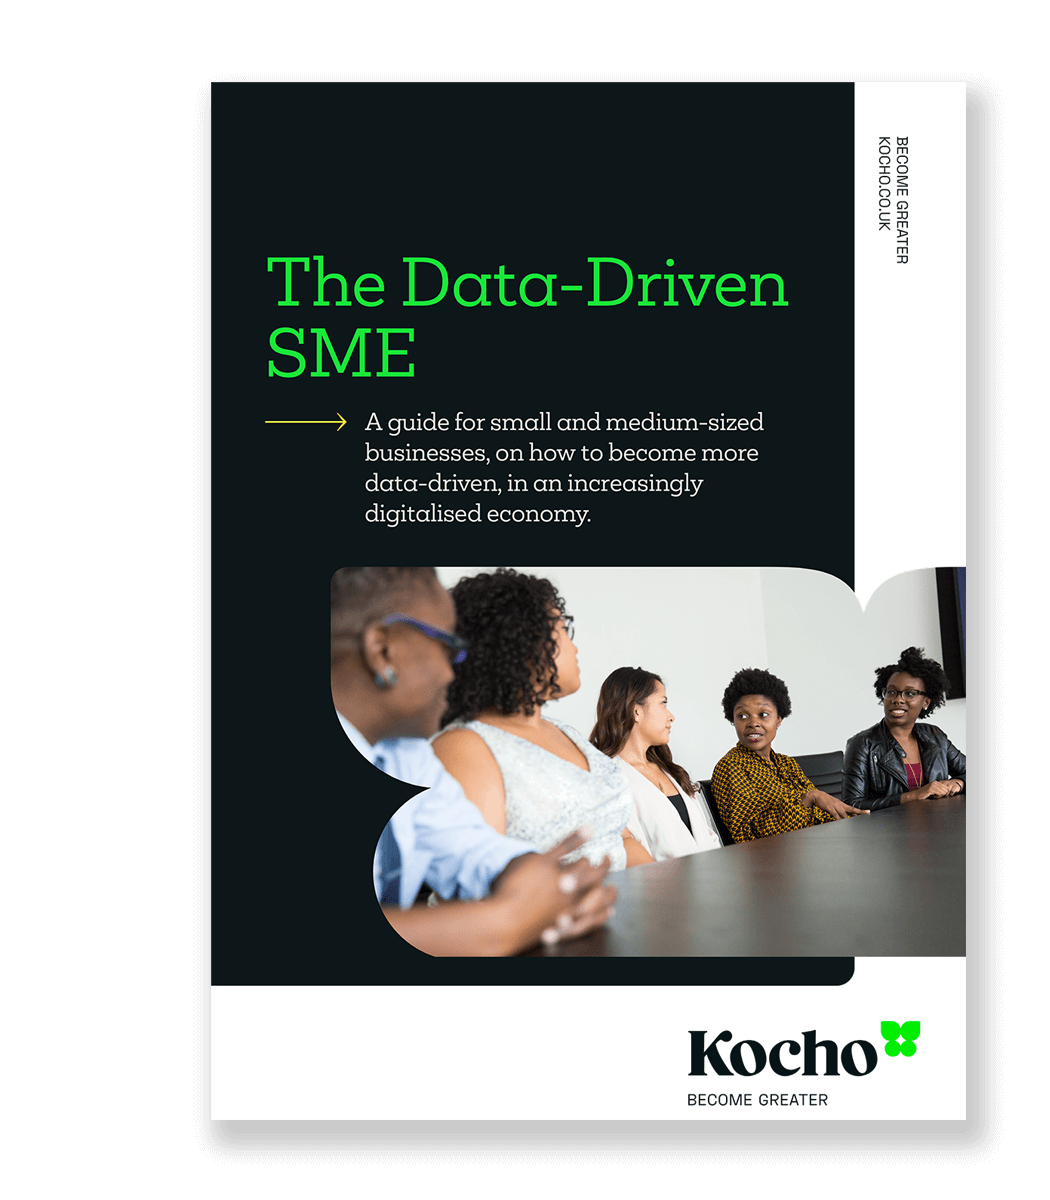
The data-driven SME
An actionable guide on becoming a more data-driven business.
Download your free guide and discover:
- Data’s critical role in decision-making
- What it means to be truly data-driven
- How to assess your current data maturity
- How to accelerate your data capability
The ways that data and analytics can be used to drive business value are as varied as the organisations themselves.
2. Unifying data resources
Organisations large and small need to pool together data from disparate sources in a coherent and accessible format. Healthcare is a prime example, where a collective of 8 Clinical Commissioning Groups (CCGs) needed to work with Local Authorities to deliver health and social care to a major UK city with a local population of 2.1 million.
They developed an analytics solution that pulled data together from all relevant care settings – acute, community, mental health, GP and social care – including information around sex, race and age.
During the current COVID pandemic, this unified system enabled them to identify spikes in certain community groups and act quickly to provide assistance and guidance. In a specific example, one borough was seeing a particular increase within the Sri Lankan community. Early visibility of this increase allowed for smartly targeted communications to schools and places of worship regarding social distancing and safety protocols.
3. Internal process management
Managing complex and dynamic processes across an organisation is increasingly hard to do using legacy systems and outdated approaches. Data and analytics can streamline these processes to provide information-driven insights.
An example of this could be seen in a mid-sized telecommunications provider that offered network solutions to their clients. This typically involved procuring multiple lines from other providers and joining them together as a managed network. They had tens of thousands of lines, for which they were paying bills on a monthly basis.
The challenge was that when clients cancelled certain lines, these lines were often not cancelled with the third-party provider. This resulted in monthly charges on lines that provided no income.
To solve this issue, they built a system using fuzzy logic to match lines across inventory, supplier bills and customer invoices. By accurately tracking their supply base they were able to cut waste and reduce unnecessary costs of approximately £800k per annum.
4. Reducing error
Errors resulting from incompatible or outdated systems, data silos, or human action can have a significant impact on the bottom line. A major energy company turned to data and analytics to help automate repetitive, but important, tasks.
The company purchased and settled contracts with a wide variety of minor energy providers (e.g. windfarms, solar parks, energy from waste). The problem was, when settling contracts, they needed to calculate what was owed based on complex industry rules overlaid with the specific terms of the contract, which varied by energy provider.
Their existing process relied on approximately 1,500 spreadsheets, managed by a team of offshore resources. These were frequently prone to error and relied on a significant manual overhead. The solution was to replace the manual process with an automated process, which resulted in a significantly reduced error rate, a reduction in over-payments, fewer resources, and faster monthly turn-around time.
5. Improving customer experience
Customers increasingly desire personalisation and flexibility. By embedding analytics into the customer experience, it’s possible to empower customers with the information and options they are looking for.
A corporate travel company was looking for solutions to increase retention of existing clients and to win new ones. They chose to run a series of requirements gathering workshops that brought together a panel of the organisations’ clients; travel managers for a variety of law firms, hedge funds and private equity firms.
This open dialogue helped to establish what questions the clients wanted to answer (e.g., What are we spending? Where are we acting out of policy?) and the level of granular detail each answer required (e.g., spending across region, function etc.)
Dashboards were developed and played back to the group for feedback and further refinement. This process helped the company to move past the static monthly reports they had previously offered, and instead put information directly into the hands of their clients – giving them immediate answers to their questions.
6. Industry-wide insight
For many organisations, business value relies on analysing a range of market factors for insights that can be easily accessed by teams across the business. For example, a global pharmaceutical company needed to quickly weigh a variety of industry-wide concerns to arrive at product pricing decisions across 90 separate markets.
Their solution had to enable pricing teams to quickly compare scenarios and iterate fast. Using a scalable modelling engine and sensitivity analysis, the company was able to leverage a range of data assets that they already had within the organisation – including clinical trials, market research, industry benchmarks, financial forecasts and more.
A suite of over 20 Dashboards were created and integrated with an Alteryx based solution to provide a robust pricing decision support tool that maximised data resources and empowered teams to make pricing decisions in a data-driven environment based on facts, not gut instinct.
7. Weighing internal and external factors
Data and analytics played a key role in how a global FTSE 100 Fast Moving Consumer Goods (FMCG) organisation with 60,000 employees attracted, retained and managed talented staff. They had in invested heavily in SuccessFactors as their new HR Information System, but over a two-year period they hadn’t gained the analytics insights they needed from the system. Specifically, their talent management team was struggling to reduce upper quartile performer churn of employees.
To grow their data maturity in this area, they moved to combine data resources from several systems – including SuccessFactors, LinkedIn, Facebook and Oxford Economics along with several manual reference files – into a cloud data warehouse.
By consolidating and analysing both internal and external data resources, their talent management team was able to compare grade and income for each employee and contextualise this information against economic factors at a local level such (average income and unemployment rates etc.) This allowed the team to ultimately reduce churn of valuable employees by identifying high performing outliers and adjusting their salary accordingly.
8. Granular insights for an organisational overview
Frequently, businesses are leveraging data and analytics to provide granular data that supports organisation-wide insight and decision making.
A major energy company required a monthly granular understanding of the margin that they were making across different market segments and a range of products. This needed to be calculated using management accounting techniques, allocating a range of industry costs using complex bottom-up calculations across 1 billion rows of data.
Their legacy systems were cumbersome to run, expensive in terms of licencing and hardware costs, and ultimately did not provide them with the granularity of insight that they required.
To solve this problem, they designed and implemented a new solution that decreased the turn-around time of the monthly view from weeks to days. This new granular level of visibility into their clients provided greater insight and transparency in the results, allowing them to increase prices with underperforming clients and reduce the overall operating costs significantly.
This article is in partnership with TrueCue as part of our Data-Driven SME series.


Free Guide
The data-driven SME
An actionable guide on becoming a more data-driven business.
Download your free guide and discover:
- Data’s critical role in decision-making
- What it means to be truly data-driven
- How to assess your current data maturity
- How to accelerate your data capability

Great emails start here
Sign up for free resources and exclusive invites
Subscribe to the Kocho mailing list if you want:
- Demos of the latest Microsoft tech
- Invites to exclusive events and webinars
- Resources that make your job easier

Don't Miss
Great AI & data analytics resources
Kocho kicks off 2026 with Microsoft Analytics on Azure specialisation

Microsoft Security Roadshow
Demos and expert insight to help you get the most from Microsoft's identity, security and cloud solutions.

Purview Demo: Securing data in the age of AI

AI-powered SecOps decoded: Transforming defence in the age of AI attacks







Got a question? Need more information?
Our expert team is here to help.


